
The sunsetting of Universal Analytics (UA) is upon us, and the introduction of Google Analytics 4 (GA4) is leaving many marketers feeling uncertain and full of questions. We have previously covered the importance of transitioning over to GA4 and how it differs to its predecessor, but what about actually using it?
Having used Universal Analytics for many years, you likely know how to find the data you need in a pinch – source/medium reports, goal completions by page, etc. All of this information is still available within the GA4 interface, either by default or via custom report creations, so we’re going to guide you through everything you need to know to leave you feeling confident that you can find the data you need, come 1st July 2023.
Understanding Your Data
Before we dive into the interface, let’s discuss some of the important differences that GA4 will bring to your data:
Hits vs. Events
Universal Analytics collects data in the form of hits. The most commonly used hit types are for pageviews and events. These hits are logged within a specific session, which in turn are logged against a specific user. All of a user’s actions on your website during a single browsing session (pages they view, forms they submit, etc.) are connected into one session. Event hits are broken down by utilising an event category, action and label – this allows for granularity in identifying specific details for each collected event. For example, a form fill could have a category = form fill, action = submit, label = contact form.
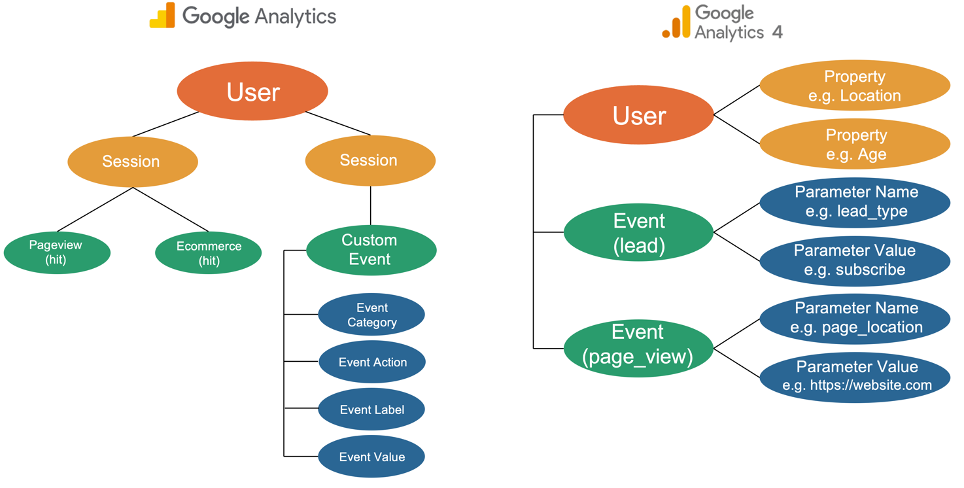
GA4 collects everything as an event, including pageviews, new session starts, etc. These events are differentiated by the parameters they are sent with – each event can contain up to 25 parameters which detail more specifics on said event i.e., the page URL or referrer. These events are associated to a user based upon various reporting identity methods (more on this later), and the user will be assigned properties with information such as their location.
The Difference Between Sessions on Universal Analytics and GA4
A session within Universal Analytics would end after 30 minutes of inactivity, after midnight, or after the campaign source of the session changes. GA4 differs from this approach by not creating a new session when the campaign source changes mid-session. This means someone who visits your website from organic search, then goes to Facebook and visits your website again will be recorded as 1 session in GA4 and 2 sessions in UA. GA4 still has a timer to end a session after a set period of inactivity – by default this is set to 30 minutes, but this can be changed freely within the user interface.
Some GA4 reports are split between the user and the session level - the difference between these reports is a matter of attribution. For example, the User Acquisition report focuses on the first traffic source that led a visitor to your website (first-click attribution), whilst the Traffic Acquisition report focuses on the most recent traffic source that led a visitor to your website (last-click attribution).
Data Thresholding
Data thresholding is critical to understand when analysing data within GA4. This is something which is applied by Google when your dataset is small/granular enough that they believe you could identify individual users. You’ll know this applied when you see a red warning indicator next to the report title.
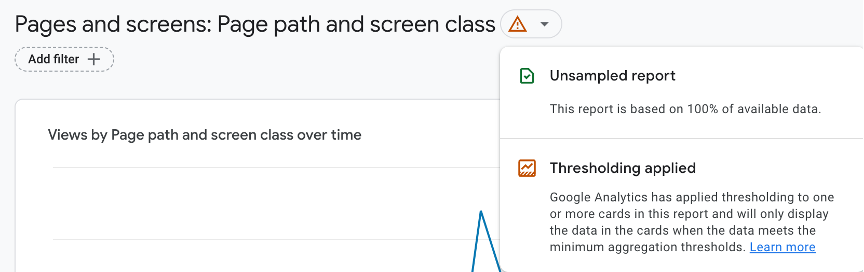
This thresholding indicates that the dataset you are currently viewing may be missing some data, and therefore not tell the whole story. To avoid data thresholding, you can change the Reporting Identity used within your property. This setting decides how many signals Google uses to identify users and will display different data depending on which option you choose. Don’t worry though, the settings can be adjusted retroactively and won’t affect the underlying data. Here are the three options:
Blended
This reporting identity is the default selection and incorporates User ID, Google Signals, Device ID and Modelling to identify your users. Google Signals uses information from users who are signed into Google accounts, whilst Modelling estimates user activity when identifiers such as cookies or User ID isn’t available, to help fill in the gaps. Due to having so many detailed data points on the user, the Blended reporting identity can often result in thresholding being applied to your reports but will likely provide more accurate data on the number of users who visited your website.
Observed
The Observed identity acts the same as Blended, just without the Modelling – so no potential gaps are filled in when cookies or User ID isn’t available. Due to the inclusion of Google Signals alongside other datapoints, data thresholding may still be likely for specific reports and timeframes.
Device-based
Finally, a device-based reporting identity simply assigns events to a user based upon their client ID – if the device/browser shares the same ID, then it’s safe to assume it’s the same user. This reporting identity misses out on the more detailed datapoints such as Google Signals, which can provide useful demographic information, but the trade-off to this is that with less detailed user information, thresholding is far less common as individuals are less likely to be identifiable. However, you might end up overreporting the number of users since Google won’t be able to identify individual users as easily.
Attribution
Universal Analytics, by default, was based upon a last non-direct click attribution model – meaning that a user journey of Organic > Email > Direct would assign 100% of the credit for a conversion towards the Email channel.
Alternatively, GA4 utilises a data-driven attribution model by default. This assigns conversion credit to touchpoints within the user journey which are deemed the most crucial/valuable, based upon historic data. For example, with a conversion path of PPC > Organic > Affiliate, Google may look at the path of PPC > Organic and note a conversion rate of 5%, and also note that PPC > Organic > Affiliate is 10%. Since the addition of the Affiliate channel to this path doubles the conversion rate, the Affiliate channel would receive a larger portion of the conversion credit in this example.
As previously explored, certain reports within GA4 such as User Acquisition and Traffic Acquisition will use different attribution models to this default model. It is always worth thinking about what report you are viewing and how it attributes its data, as this may impact your analysis.
Metrics and Dimension Changes Within GA4
When viewing your reports within GA4, you may notice some new metrics/dimensions. In addition to this, some of these metrics may have changed in ways which are not immediately apparent.
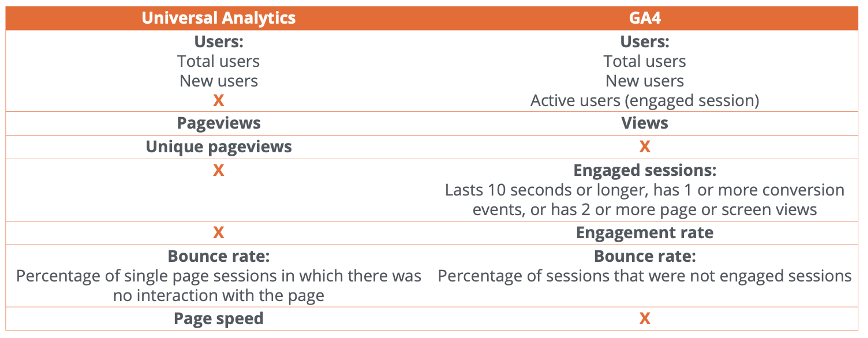
Unique Pageviews and Page Speed are not currently present within GA4, whilst Engaged Sessions have been added - by default, a session is considered engaged if it lasted longer than 10 seconds, had a conversion event, or had 2 or more screen or page views. The introduction of Engagement Rate also slightly affects how Bounce Rate is now calculated – this now acts as an opposite of Engagement Rate, calculating a percentage of sessions which were not engaged.
It is worth noting that Google Analytics 4 is still a work-in-progress. Further standard features you may be used to, such as annotations, aren’t currently available, whilst some other basics have only recently been deployed, such as custom channel groupings. It’s worth keeping up-to-date with Google’s What’s New page, to know when any changes or additions are imminent.
Navigating Your Data
Now that you’re aware of how your data may differ between GA4 and UA, let’s take a look at navigating the GA4 interface to find everything you need in a flash.
By default, your GA4 interface will have both a Life Cycle and User folder, each containing multiple sub-folders with specific reports inside - this structured approach shares many similarities with Universal Analytics. We know that certain reports are often used more than others within UA, so we’ll go through some of the key reports found within these folders, as well as how to edit these to suit your needs and create new sub-folders to structure the interface in a way that benefits you the most.
Acquisition
Traffic Acquisition
Within the Traffic Acquisition report, you can find breakdowns of channel groupings, source/medium and campaign. Within this report, you can click the drop-down arrow of the primary dimension and change this as desired. This means GA4 shows less reports than UA – they haven’t disappeared, they’re just hidden!
As previously discussed, this report and the User Acquisition report will use their own attribution method. Within this report you will be viewing the last click that brought the user to your site. This is where you can dive into specific mediums or campaigns and see where your traffic is coming from.
Remember to utilise both the search bar and the blue “+” icon to add secondary dimensions to any report you view or to filter your data. For example, we can set the primary dimension to source/medium, add a secondary dimension of Country, and then search for “google / cpc”. We can then view all traffic generated by Google Ads, broken down by country.
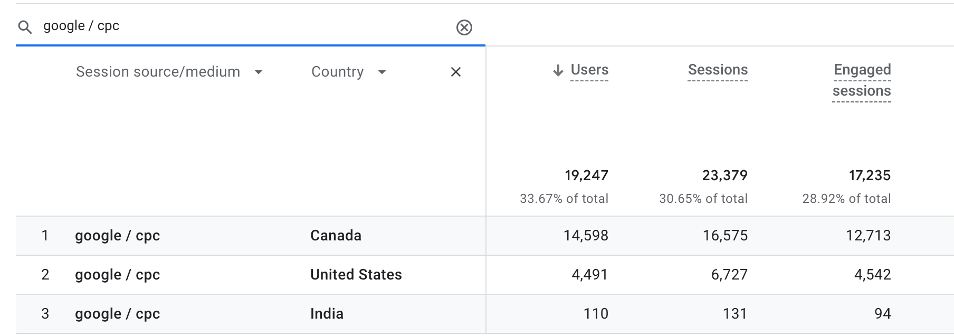
This could also be used with the secondary dimension of “Session Campaign” to view metrics for specific Google Ads campaigns you may be running.
User Acquisition
Similarly to the Traffic Acquisition report, the User variant will show us the first click that initially led the user to your site. The reports are pretty similar to the Traffic Acquisition reports. We can even take this level of interaction one step further with most reports by utilising comparisons or filters.
By clicking “Add Comparison” at the top of the page, you can compare two segments of users. In this example, we’ve compared All Users with Mobile Users, to see which medium brought them to the site:
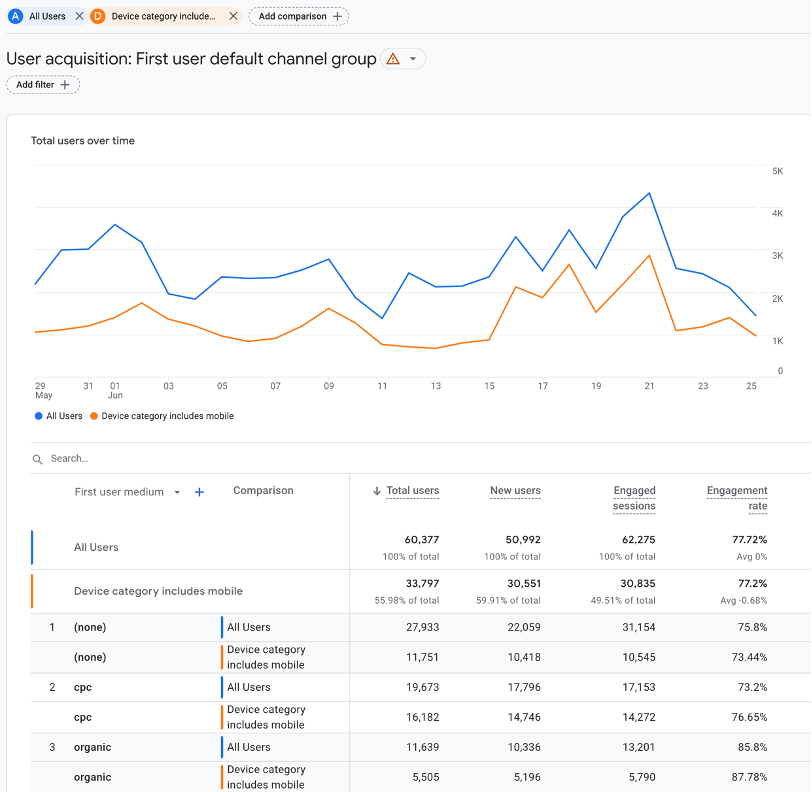
Alternatively, we could remove this comparison and simply click the “Add Filter” option to filter our data based on one segment only.
With simple changes to reports such as these, you can quickly find answers to some of your more specific questions and gain valuable insights to make informed decisions.
Engagement
Events
Here you will find a list of all events which have been triggered on your site within your specified timeframe.
The GA4 events report faces some changes in contrast to its UA counterpart. Since GA4 is an event-based property, you will now notice many new entries within this report, such as page_view, session_start, etc. Events are also no longer broken down by Category/Action/Label, and we instead now rely on parameters to differentiate events.
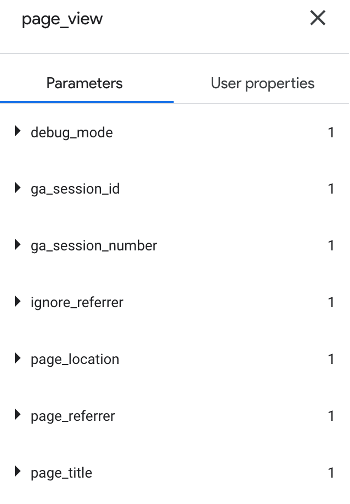
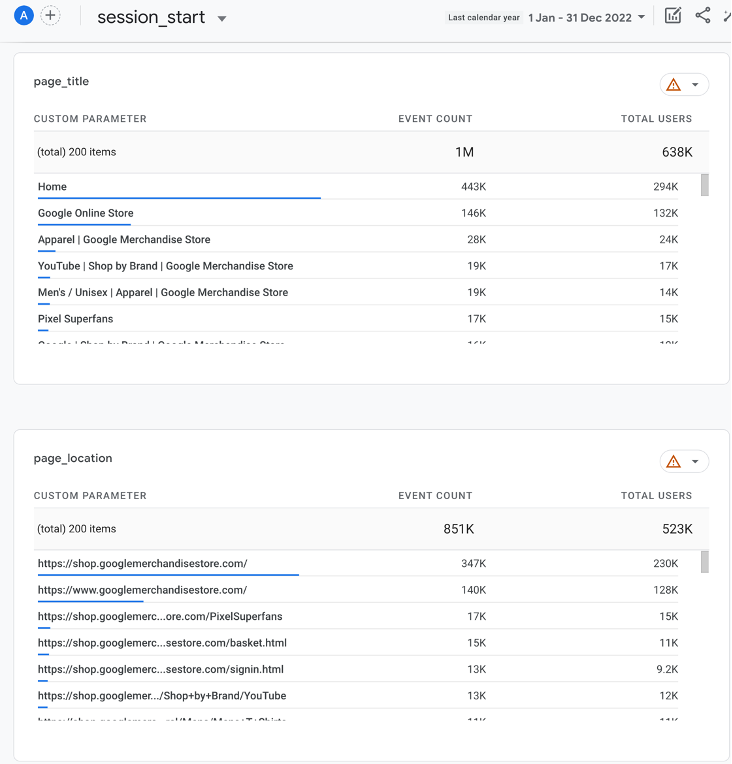
Let’s use session_start as an example, which is an automatically tracked event. Clicking into this event will show you parameter values for specifics such as the page location, title, and referrer for this session start:
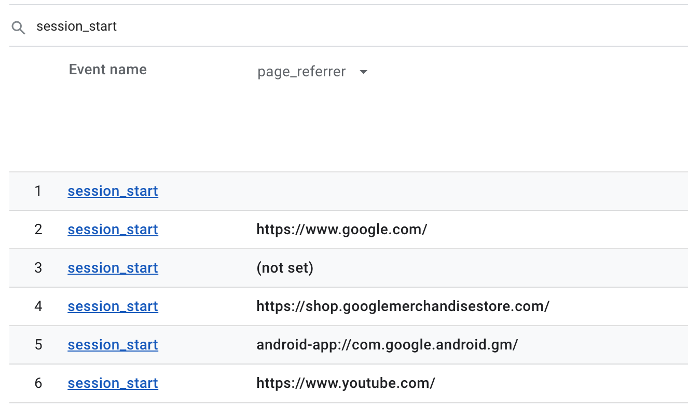
As previously demonstrated, we can also utilise the search bar within the Events report to show only this specific event, and add a secondary dimension alongside this, such as page_referrer, to see a quick list of which sites brought the user to our site to trigger this event:
Conversions
What was once known as Goals within Universal Analytics are now referred to as Conversions within GA4. Due to the changes in how event collection now works (utilising parameters as opposed to Category/Action/Label), conversion creation has also changed.
Rather than defining criteria that must be met to trigger a goal, events are now simply toggled to be a conversion. This report will show you all events which have been marked as a conversion, allowing you to quickly see their performance metrics.
Pages and Screens
This section of the report is where you can dive into specific pages of your site to review performance. The primary dimension can be adjusted to either view the page path, page title, or content group, depending on your needs. The Event Count and Conversions metrics both have a drop-down arrow you can utilise if you’d like to view a page’s performance for a specific action.
For example, if you would like to know how many file_download events are triggered from a specific page of your site, you can select the dimension of “Page path and screen class”, use the search bar to look for your specified page, and alter the Event Count dropdown to show only file_download events.
Landing Page
This report behaves similarly to the Pages and Screens report, except it will show you the initial page a user landed on when first visiting your site in a new session.
Monetisation
E-commerce Purchases
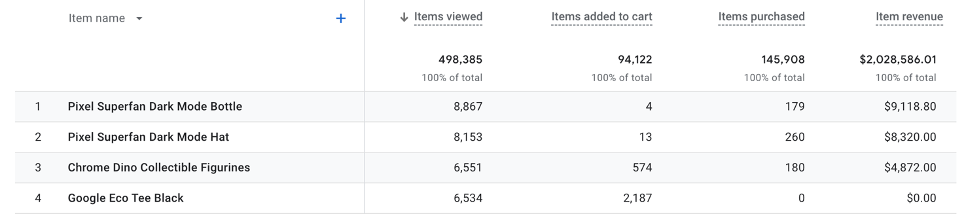
If you are running an e-commerce site with tracking setup to capture purchases, item views, etc., then this is where you will find the breakdown in performance for your sales. The primary dimension can be changed to display the item name, ID, category or brand.
This report can be used to monitor the performance of specific products, or for your store as a whole, allowing you to dive into how many times an item was viewed vs. how many times it was added to the cart and subsequently purchased, alongside the revenue these purchases have generated.
User Attributes
Demographic Details
The Demographic Details report is where you will find breakdowns of users’ countries, cities, language, age, etc. Many of these dimensions rely on access to user information obtained from Google Signals and therefore may not be available or entirely representative of your userbase when certain reporting identities are used (check our Reporting Identity section at the beginning).
This report can be useful to learn more about who is using your site. For example, you may set the primary dimension to Language and observe the engagement rates – if a particular language is showing a large user count but a low engagement rate, it may be beneficial for you to review how well your website caters to users who speak this language.
Tech
Tech Details
Finally, the Tech Details report can offer you beneficial insights into how users are viewing your site and highlight potential technical issues. You can choose between the browser used, operating systems, device types, etc.
Similarly to the demographics report, this data can help you observe key segments of your userbase who could be better supported. For example, if you note a lower engagement from tablets within the device categories report, you should probably review how your website displays on tablet and improve UX for this device.
Editing & Creating New Reports
Whilst we have covered some of the most used reports within Google Analytics, you may notice that you are regularly adding specific filters to certain reports, or particular metrics are missing that you would like to see.
When viewing a report, you can click the pencil icon in the top right to customise it to your liking. Once in the editor, you can remove any excess dimensions or metrics which are not required, or add further ones to your report. Filters can also be added if you need to get really specific in the data you see.
For example, you could customise the Traffic Acquisition report to always show the source/medium as the primary dimension, further broken down by channel group, and exclude all source/mediums which display as “(not set)”. To do so, you would edit the dimensions to remove everything except “Session source/medium”, customise the metrics to suit your requirements (in this example we’ll use Users, Sessions and Conversions), add an exclusion filter to exclude the “(not set)” entries, and add a secondary dimension of “Session campaign”:
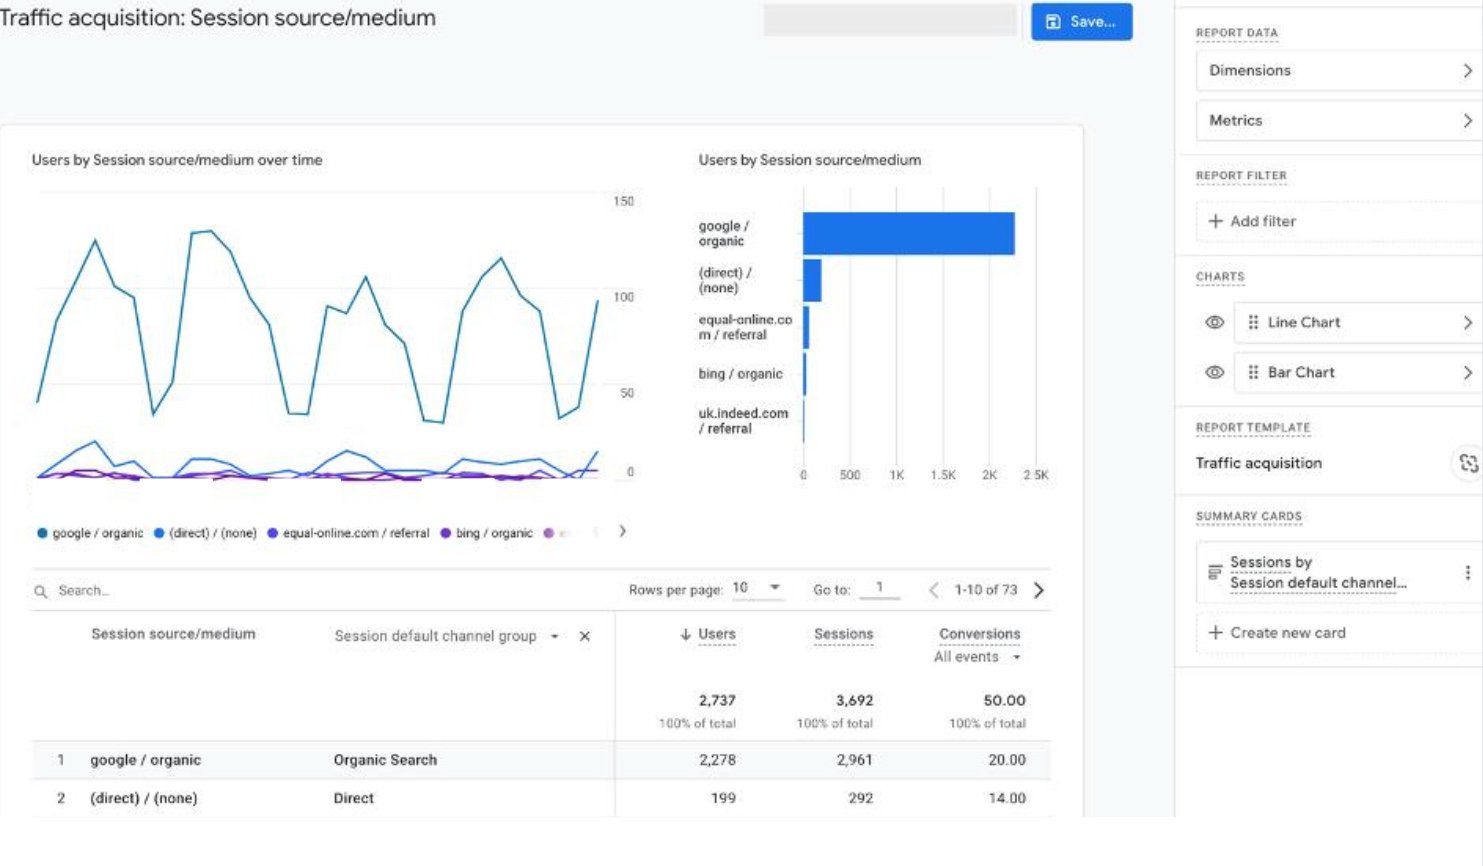
To save this report, you’ll be presented with two options. “Save changes to current report” will overwrite the initial report you selected to edit – every time you’ll click into the Traffic Acquisition, you will see this edit. “Save as a new report” will allow you to name and save it as an entirely new report, leaving the original Traffic Acquisition report intact. But if you save this as a new report, how do you access it again in the future?
Report Library
Once a new report has been saved, you can find it within the Report Library.
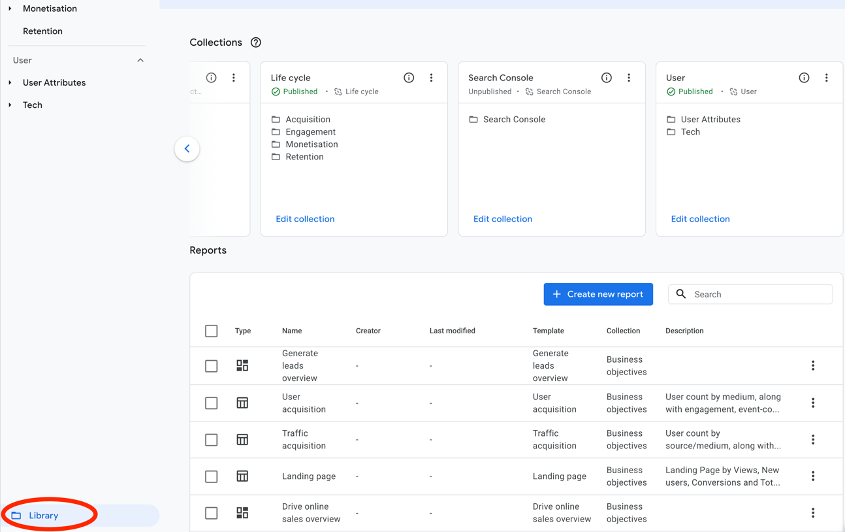
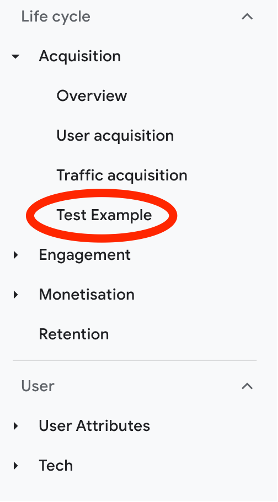
By searching for the name of the new report you just saved, it’ll be accessible for you to open and view once again. If you’d like a more seamless approach to viewing this new report, you can edit the folder structure of the main interface. As we’ve already discussed, the default folder structure of the interface shows the “Life Cycle” and “User“ folders, which contain multiple sub-folders. Within the library menu, the Life Cycle and User folders are visible within the “Collections” area. By editing a specific collection, you can drag and drop new reports in specific sub-folders to create a customised interface. You can experiment with creating new collections and folder structures to have all of your most-used reports within clicking distance.
If you have linked your GA4 property to Google Search Console then you may also notice a new collection has been made available to you, aptly named “Search Console”. By publishing this, you will add a new folder structure to your interface containing this report for quick access.
Google Looker Studio
Sometimes, editing reports within the GA4 interface doesn’t quite cut it. Limitations in the presentation of the data, or creating more complex filters can add unnecessary friction to your analysis, especially when you need to revisit specific metrics regularly.
We recommend setting up a personalised report within Google Looker Studio, which would contain everything you need in an efficient, accessible, and digestible format. Innovation Visual create such reports for our clients as standard, allowing them to see what matters most at a glance.
Need a Helping Hand with GA4?
Now you know all there is to understanding and navigating your data within GA4, you can leverage this to better understand your users and enrich your marketing decisions.
We know that Universal Analytics has been the norm for many years, and so the transition to implementing and working within GA4 may sound daunting – there’s a lot going on! But there’s no need to worry, Innovation Visual can help. Contact us to discuss your analytics requirements and ensure you’re looking at clean data to make informed decisions. Once your data is clean, we can help you maximise your revenue through digital marketing


-1.png?width=250&height=141&name=image-gen%20(1)-1.png)


